
What Visible EO Can (and Can’t) See, and the SWIR Advantage
Global demand for critical minerals such as lithium, cobalt, copper and rare earth elements is accelerating to support the energy transition, and the mining and resource sector is under growing pressure to expand supply while meeting tighter environmental and safety expectations. Mining companies, environmental regulators, financial auditors and sovereign agencies increasingly need frequent, wide-area information to track site development, verify environmental compliance and screen for new prospects.
Traditional ground surveys and aerial flyovers are expensive, can be hazardous, and are difficult to scale across remote or politically unstable regions. Satellite Earth Observation (EO) is now a core tool for remote site intelligence. Standard visible imagery, however, leaves important gaps: it shows what a site looks like, but says little about what surfaces are made of or how wet they are.
Short-Wave Infrared (SWIR) imaging helps close those gaps. Combined with high-resolution visible and near-infrared (VNIR) imagery, it adds information on surface moisture and material that visible cameras cannot provide. This paper explains what each type of sensor can and cannot do for mining applications, where the scientific evidence is strongest, and how the LatConnect 60 (LC60) SWIRSAT constellation is designed to deliver both layers together.
| EARTH OBSERVATION MINING STACK | |
| VISIBLE AND NEAR-INFRARED (VNIR) EO | SHORT-WAVE INFRARED (SWIR) |
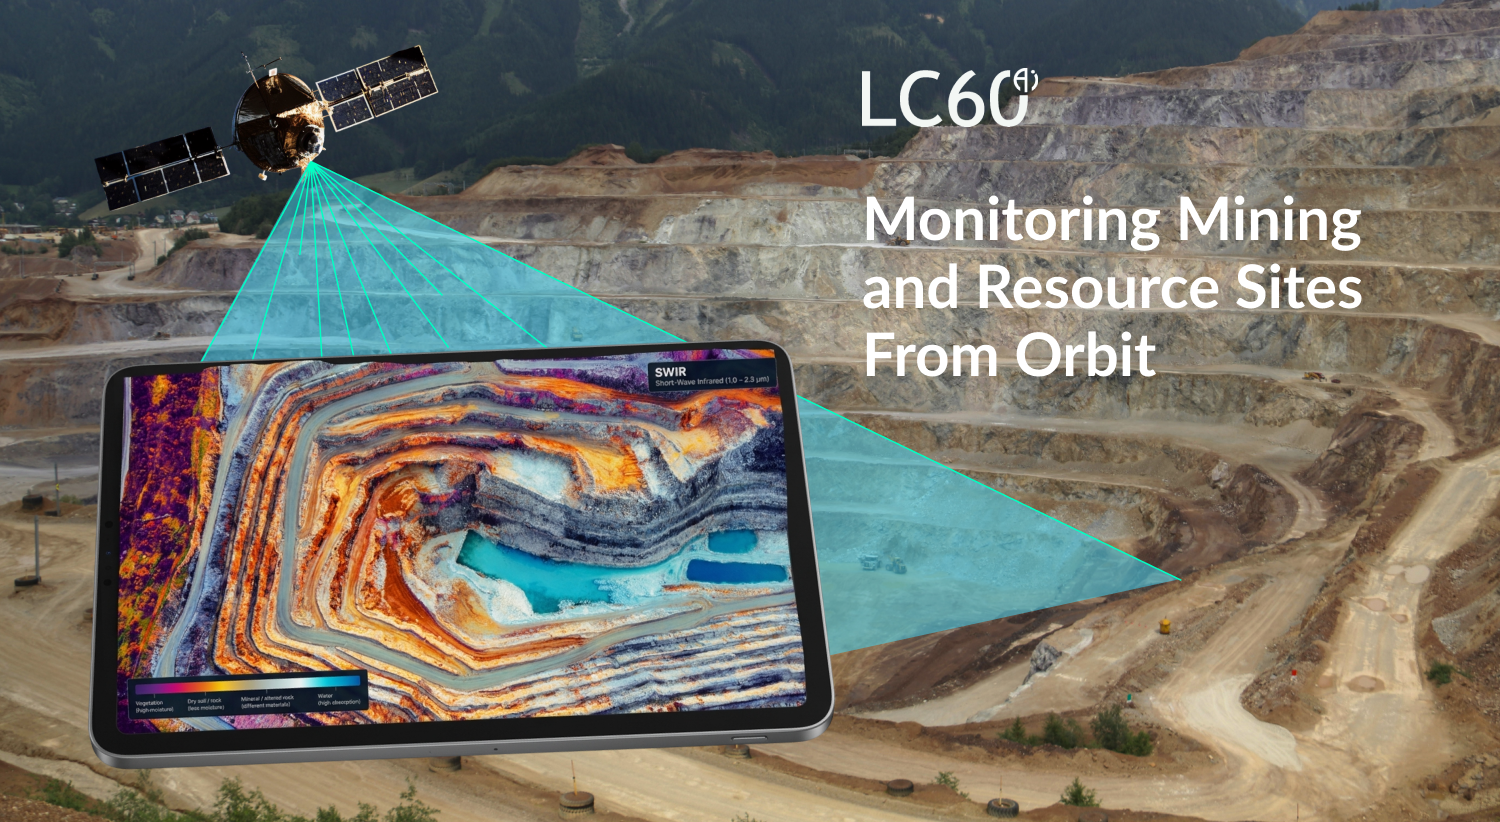
| Spatial footprints and pit boundariesHeavy machinery and haul road activityLand disturbance and rehabilitationVegetation condition (NDVI, red-edge) | Surface moisture and wet/dry contrastTailings and water-management surfacesMaterial and surface-type discriminationAcid mine drainage screeningMineral mapping (extended SWIR bands) |
1. What Visible and Near-Infrared (VNIR) Satellite Imagery Can See
Standard electro-optical sensors record reflected sunlight in the visible range (about 0.4–0.7 µm) and usually the near-infrared out to about 1 µm. Commercial systems now deliver spatial resolutions of 30–50 cm, which gives clear context for surface infrastructure and activity.
Surface Infrastructure and Spatial Footprints
Pit Expansion and Cut-and-Fill Tracking
High-resolution optical satellites are well suited to tracking physical land disturbance over time. By comparing images from different dates, site managers and auditors can measure open-pit boundary expansion, topsoil stripping and waste-dump growth, and check whether disturbance stays within permitted lease boundaries.
Heavy Machinery and Haul Road Activity
At sub-metre to metre-scale resolution, analysts can identify large mining equipment, stockpiles, haul roads, drill patterns, conveyors and processing infrastructure. Counts of visible equipment and changes in road and stockpile condition are useful indicators of operational tempo, although they are not a direct measure of throughput on their own.
Vegetation Health and Surface Water
Red and near-infrared bands support vegetation indices such as the Normalized Difference Vegetation Index (NDVI), and red-edge bands add sensitivity to vegetation vigour. These indices help monitor clearing around mine boundaries, track rehabilitation progress, and flag vegetation stress that may be linked to ground disturbance or changes in water availability.
2. Where Visible Imagery Runs Out
Despite its spatial detail, visible and near-infrared imagery mainly records surface colour and brightness. Many of the geological, hydrological and environmental properties that matter most at a mine are only weakly expressed there.
Limited Ability to Identify Mineral Composition
A clay-altered zone, a weathered granite outcrop and a lithium-bearing pegmatite can look very similar in true-colour imagery. Visible and near-infrared bands can separate some iron-oxide-rich surfaces, but they cannot reliably distinguish most hydroxyl-bearing, carbonate or clay minerals. As a result, they are of limited use on their own for mineral mapping.
Limited Insight Into Moisture and Water Chemistry
Visible imagery can show standing water and obvious staining on tailings facilities, but it cannot say how wet a surface is, and it cannot tell clean water from acidic or metal-bearing water. Acid mine drainage (AMD) often leaves orange and yellow iron staining that is visible in the image, but the pattern of the underlying iron minerals, which indicates acidity and metal mobility, requires spectral information beyond the visible range.
Haze, Dust and Smoke
Blasting, crushing, hauling and wildfire smoke put aerosols into the air. Dust and haze reduce contrast in visible imagery and can obscure pit floors and working faces. Cloud, of course, blocks all optical sensors.
3. The SWIR Advantage in Mining and Geology
Solar-reflective SWIR covers roughly 1.0–2.5 µm. (Beyond about 2.5 µm, little reflected sunlight reaches a satellite, and strong atmospheric water-vapour absorption closes parts of the range near 1.4 and 1.9 µm.) In this range, absorption features arise from vibrations of molecular bonds in water, hydroxyl (OH), carbonate and other groups, so SWIR measures something about what a surface is made of and how wet it is, rather than only how it looks [11].
Principle: sunlight → mineral or wet surface → wavelength-specific absorption → spectral signature that can be compared against reference libraries [7].
Mineral Mapping and Exploration
Alteration Mapping
Many hydrothermal deposits, including porphyry copper, epithermal gold and volcanogenic massive sulfide systems, are surrounded by alteration zones containing hydroxyl-bearing minerals. Minerals with Al-OH, Mg-OH and carbonate bonds, such as kaolinite, alunite, white mica, chlorite and calcite, show sharp, diagnostic absorption features between about 2.1 and 2.4 µm [6,7]. Satellite and airborne SWIR sensors have been used for decades to map these zones and help geologists prioritise areas for follow-up. SWIR maps alteration mineralogy; it does not measure ore grade, so it works best as a screening tool ahead of geochemistry and drilling.
Lithium and Critical Minerals
Remote sensing is a growing part of lithium exploration. Published studies use multispectral and hyperspectral optical data to map host-rock lithology, alteration and certain lithium-bearing or associated minerals (for example micas and clays), and to narrow down areas for field work [5]. Detection is often indirect, and results depend on mineralogy, spectral coverage, vegetation and surface cover. Used as a regional screening layer, it can help focus field effort.
Environmental and Tailings Monitoring
Tailings Surface Moisture
Tailings Storage Facilities (TSFs) are among the highest-consequence assets in mining. A global review estimated a failure rate of about 1.2% across more than 18,000 mine sites, more than 100 times that of conventional water-retention dams [4]. Water strongly absorbs SWIR radiation, so wet ground appears darker in SWIR bands and dry ground brighter, which makes SWIR a sensitive indicator of surface moisture, ponding and wet-dry change on beaches, embankment faces and nearby ground. Repeated SWIR observations can highlight areas where surface wetness changes unexpectedly and prompt targeted inspection.
Scope note: optical SWIR senses only the top millimetre or so of a surface [3], so it reports surface moisture, not conditions inside the dam. Satellite radar (InSAR) has detected precursor ground deformation at the Brumadinho dam before its 2019 failure [2]. SWIR surface-moisture monitoring and InSAR deformation monitoring answer different questions and are best used together with in-situ geotechnical instruments.
Acid Mine Drainage and Mine-Waste Mineralogy
When sulfide minerals such as pyrite are exposed to air and water, they oxidise and generate acid and dissolved metals. As acidic water drains and is neutralised, it deposits iron-bearing secondary minerals in characteristic zones: jarosite where conditions are most acidic, and goethite where they are closer to neutral. Airborne imaging spectrometer studies have mapped these zones and used them to screen mining districts for acid-producing sources [1]. Jarosite has a diagnostic SWIR feature near 2.27 µm [7], while goethite is recognised mainly through iron absorption near 0.9 µm in the near-infrared, so VNIR and SWIR information are best used together. Satellite SWIR can support this kind of screening, particularly of waste rock, tailings and exposed surfaces, with finer-scale or water-chemistry questions confirmed by field sampling.
Haze, Smoke and Dust
Scattering by small particles falls off rapidly with increasing wavelength, so SWIR imagery is generally less affected than visible imagery by haze and thin to moderate smoke. The advantage is smaller for the coarse particles that dominate mineral dust, whose scattering varies little with wavelength [8], and dense smoke or cloud still blocks SWIR. In practice, SWIR can extend usable collection windows in hazy conditions rather than guarantee clear views.
4. VNIR vs. SWIR vs. SAR in Resource Site Monitoring
The most complete picture of a resource site comes from combining sensor types. Optical sensors (VNIR and SWIR) are passive and rely on sunlight. Synthetic Aperture Radar (SAR) is active and provides complementary measurements.
| Capability / Application | Visible and NIR (VNIR) | Short-Wave Infrared (SWIR) | Synthetic Aperture Radar (SAR) |
| Typical wavelength | ~0.4–1.0 µm | ~1.0–2.5 µm (solar-reflective) | ~1 cm to ~1 m (microwave; X-band ~3 cm, C-band ~5.6 cm, L-band ~24 cm) |
| Primary mining value | Spatial and infrastructure tracking; vegetation condition | Surface moisture and material information; alteration mapping with extended SWIR bands | Millimetre-to-centimetre ground and structure deformation (InSAR, where coherence allows); change detection |
| Haze, dust and smoke | Contrast reduced | Improved in haze and thin to moderate smoke; limited in dense smoke and coarse dust | Largely unaffected |
| Cloud | Blocked | Blocked | Penetrates |
| Mineral information | Limited (some iron oxides) | Strong, depending on bands covered | None (structure and surface roughness only) |
| Day / night | Daytime only | Daytime only (passive solar reflectance) | Day and night |
Table 1. Indicative comparison of sensor types for mining applications. Performance depends on the specific sensor, bands, resolution and conditions.
5. Next-Generation Mining Intelligence with LatConnect 60 (LC60) SWIRSAT
LatConnect 60 (LC60) is an Australian Earth-observation company building the SWIRSAT constellation: aligned VNIR and SWIR imaging in a single, harmonised system. Today, high-resolution visible imagery is widely available and SWIR data is mostly coarse, scarce or limited in tasking. SWIRSAT is designed to sit in between, adding commercial-grade SWIR at 4–8 m with high-resolution VNIR, a wide swath and frequent revisit, so that spectral information can be applied to operational site monitoring rather than only to scientific studies.
The first two satellites, SWIRSAT-1 (mid-inclination orbit) and SWIRSAT-2 (sun-synchronous orbit), are planned for launch in Q1 2027. Additional satellites are planned to extend revisit and capability.
SWIRSAT at a Glance
| Parameter | SWIRSAT-1 | SWIRSAT-2 |
| SWIR resolution | 8 m native; 4 m Super HD | 8 m native; 4 m Super HD |
| SWIR bands | 4 bands: 1268, 1364, 1572, 1650 nm | 4 bands: 1268, 1364, 1572, 1650 nm |
| VNIR resolution | 1.5 m native; 75 cm Super HD | Not applicable (SWIR only) |
| VNIR bands | Multispectral, 490–842 nm (including red-edge bands), plus 625 nm panchromatic | Not applicable |
| Swath width | 11 km at nadir | 11 km at nadir |
| Revisit | 4–7 days (latitude dependent) | 10 days (latitude dependent) |
| Orbit | LEO, mid inclination (30°) | LEO, sun-synchronous (98.2°) |
| Planned launch | Q1 2027 | Q1 2027 |
Table 2. SWIRSAT-1 and SWIRSAT-2 imagery specifications (LC60 data sheet). Product levels offered: Basic (L1B), Standard (L1C), CEOS Analysis Ready Data surface reflectance (L2A) and a greenhouse-gas retrieval product (L3G), delivered as GeoTIFF with STAC metadata.
What the SWIRSAT Bands Offer for Mining
The four SWIR bands sit in the 1.2–1.7 µm region, where water and moisture, vegetation water content and many surface materials show strong contrast, and where atmospheric scattering is reduced. Together with the VNIR bands, they support the following.
| Band | Primary interaction | Mining relevance |
| SWIR 1268 nm | Vegetation water content; lies in an atmospheric window | Vegetation condition and rehabilitation monitoring; stable surface-reflectance reference |
| SWIR 1364 nm | Water absorption region; moisture sensitivity | Surface moisture and wet/dry anomalies on tailings, stockpiles and haul roads, particularly where atmospheric water vapour is low |
| SWIR 1572 nm | Mineral and material absorption; reduced atmospheric scatter | Discrimination of broad surface-material classes (for example rock, soil, tailings, concrete); spectral change detection |
| SWIR 1650 nm | Smoke and haze penetration window; moisture sensitivity | Observation through haze and thin smoke; moisture-sensitive indices when combined with VNIR, as in NDII-type indices [9,10] |
| VNIR 490–842 nm | Visible colour, red edge, near-infrared | Infrastructure, equipment and boundary mapping at 75 cm to 1.5 m; NDVI and red-edge vegetation indices; ferric-iron contrast |
Table 3. SWIRSAT bands and mining relevance. Band-specific performance is subject to calibration and validation after launch.
Applications
- Tailings and water-management surfaces. Repeated 4 m SWIR moisture observations, interpreted alongside 75 cm VNIR geometry, can highlight changes in beach extent, ponding and embankment wetness across a facility. These flags tell engineers where to look; they complement radar deformation monitoring and in-situ instruments rather than replace them.
- Concession compliance and land disturbance. High-resolution VNIR provides disturbance and boundary mapping, while SWIR adds material and moisture change that can be hard to see in colour imagery, supporting audits and encroachment screening.
- Stockpiles, waste dumps and haul roads. Combined VNIR and SWIR imagery supports monitoring of stockpile and dump change, road condition and surface wetness (including the effect of dust-suppression watering).
- Acid mine drainage and mine-waste screening. Wide-area SWIR and VNIR data can help identify and monitor mine-waste surfaces and seepage-prone areas for follow-up sampling, building on spectral-mapping methods established with airborne sensors [1].
- Rehabilitation and vegetation. VNIR red-edge bands and SWIR vegetation-water bands allow progress on revegetation and the effects of disturbance on nearby vegetation to be tracked over time.
- Bulk-commodity logistics. The 11 km swath and VNIR resolution cover ports, rail loadouts and stockyards, supporting monitoring of export logistics alongside the mine itself.
- Regional exploration screening and baselining. Regional-scale SWIR and VNIR coverage can help prioritise target areas through surface material and moisture contrast, and establishes a spectral baseline ahead of extended-SWIR capability.
- Emissions-related monitoring. LC60 lists a Level 3G greenhouse-gas retrieval product (concentrations in ppm) within its product suite.
Space Edge Computing and Data Delivery
SWIRSAT includes on-orbit AI analytics intended to cut latency and speed up cueing. Automated feature extraction on board can flag candidate events, such as new surface disturbance outside a lease, unusual moisture change near a tailings embankment, or a surface spill, so that relevant data reaches site managers and compliance teams sooner. These alerts are cues for analyst and engineer review. LC60 also supports direct downlink to customer-controlled ground stations and processing on customer-managed infrastructure, which suits sovereign and sensitive operations.
Roadmap: Extending Into the Mineral-Diagnostic SWIR Range
The initial SWIR bands focus on moisture, vegetation and surface-material contrast. LC60 plans additional SWIRSAT satellites with better than 3 m native SWIR resolution (1.5 m HD) and future constellation spectral capability well into the 2000 nm range, which moves coverage toward the 2.0–2.5 µm region where hydroxyl-, carbonate- and sulfate-mineral features are diagnostic. Nine or more satellites would provide global daily revisit. Customers who start now build a baseline archive and workflows that carry forward as capability grows.
Operating Guidance
To get the best results, SWIRSAT data should be used with an understanding of the following.
- SWIRSAT is a passive, daytime sensor; cloud and dense smoke or dust will block observation, and radar or thermal systems provide complementary coverage.
- Anomaly detection improves with a good baseline, so early collection over areas of interest is recommended.
- At 4–8 m SWIR resolution, narrow features such as small streams or individual vehicles may not be resolved; VNIR imagery at 75 cm to 1.5 m provides context.
- Moisture, material and mineral interpretations should be validated with ground truth, such as field sampling and in-situ instruments.
Help Shape the SWIRSAT Roadmap
SWIRSAT is being built around real operating needs, and the mining and resource sector is one of the clearest. The first two satellites are planned for launch in Q1 2027, and the design of the next satellites is still open.
We would like to hear from mining companies, exploration teams, tailings and environmental specialists, auditors and regulators about:
• Which sites, commodities and regions matter most for monitoring
• Which questions you most need answered, such as tailings and water management, rehabilitation, compliance, exploration screening or logistics
• How often you need to revisit a site, and how quickly you need the data
• Which spectral bands, resolution and data products would make the biggest difference, including extended SWIR coverage for mineral mapping
• How you want to receive the data: direct downlink, your own platform, or ready-made analytics
If you would like to contribute, trial early data or discuss a pilot, please get in touch at arvind.rampal@latconnect60.com or www.lc60.ai. Your input will directly inform what we build next.
Arvind Rampal
Global Head of Commercial Strategy- LC60 AI
References
[1] Swayze, G.A., Smith, K.S., Clark, R.N., et al. (2000). Using imaging spectroscopy to map acidic mine waste. Environmental Science & Technology, 34(1), 47–54. doi:10.1021/es990046w
[2] Grebby, S., Sowter, A., Gluyas, J., Toll, D., Gee, D., Athab, A., & Girindran, R. (2021). Advanced analysis of satellite data reveals ground deformation precursors to the Brumadinho Tailings Dam collapse. Communications Earth & Environment, 2, 2. doi:10.1038/s43247-020-00079-2
[3] Norouzi, S., Sadeghi, M., Liaghat, A., Tuller, M., Jones, S.B., & Ebrahimian, H. (2021). Information depth of NIR/SWIR soil reflectance spectroscopy. Remote Sensing of Environment, 256, 112315. doi:10.1016/j.rse.2021.112315
[4] Azam, S., & Li, Q. (2010). Tailings dam failures: a review of the last one hundred years. Geotechnical News, 28(4), 50–53.
[5] Cardoso-Fernandes, J., Teodoro, A.C., Lima, A., Perrotta, M., & Roda-Robles, E. (2020). Detecting lithium (Li) mineralizations from space: current research and future perspectives. Applied Sciences, 10(5), 1785.
[6] van der Meer, F.D., van der Werff, H.M.A., van Ruitenbeek, F.J.A., et al. (2012). Multi- and hyperspectral geologic remote sensing: a review. International Journal of Applied Earth Observation and Geoinformation, 14(1), 112–128.
[7] Clark, R.N., Swayze, G.A., Wise, R., et al. (2003). USGS Digital Spectral Library splib05a. U.S. Geological Survey Open-File Report 03-395.
[8] Dubovik, O., Holben, B., Eck, T.F., et al. (2002). Variability of absorption and optical properties of key aerosol types observed in worldwide locations. Journal of the Atmospheric Sciences, 59(3), 590–608.
[9] Gao, B.-C. (1996). NDWI – a normalized difference water index for remote sensing of vegetation liquid water from space. Remote Sensing of Environment, 58(3), 257–266.
[10] Hardisky, M.A., Klemas, V., & Smart, R.M. (1983). The influence of soil salinity, growth form, and leaf moisture on the spectral radiance of Spartina alterniflora canopies. Photogrammetric Engineering and Remote Sensing, 49(1).
[11] Hunt, G.R. (1977). Spectral signatures of particulate minerals in the visible and near infrared. Geophysics, 42(3), 501–513.